Assigned: April 2
Due: April 9
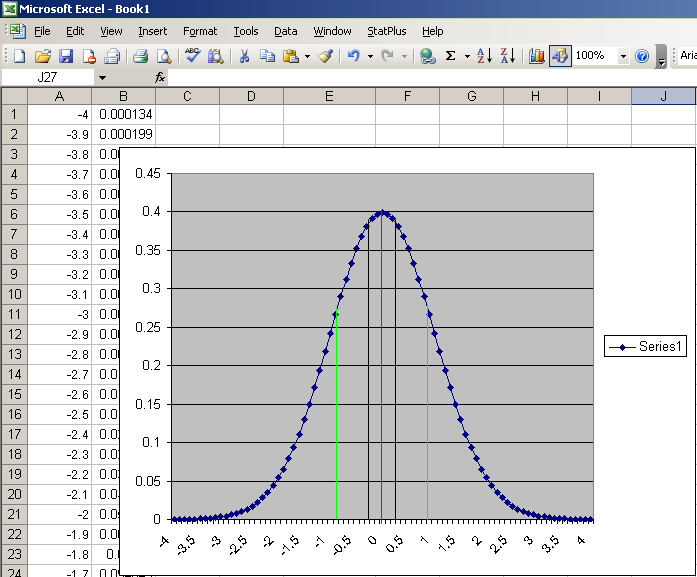
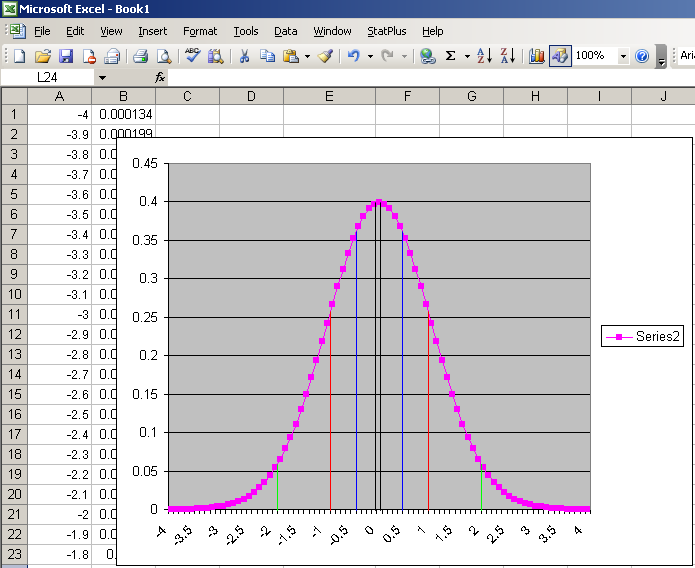
First, we must review the Standard Normal Curve, as it will be useful with this project. A Standard Normal Curve is a normal distribution with μ = 0 and σ = 1.
A z-Test Statistic allows us to express a sampling distribution of the sample average in terms of a standard normal distribution. To do this, we must subtract μ from the sample average, then divide by the standard error. We can write this as:
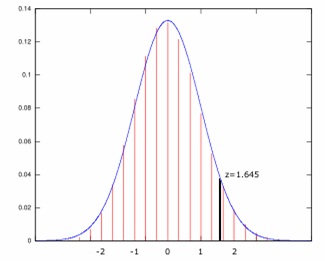
A z-Value, usually written zp, is a value on the standard normal curve such that p-percent of the area under the curve is to the left of this value. Another way to write this is the point z on a standard normal curve such that:

For example, z0.95 = 1.645, so 95% of the area under the curve is to the left of 1.645:
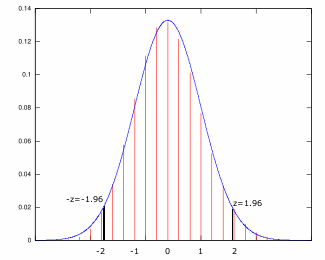
Two sided z-Values are similar to One sided z-Values, except the probability p, is the probability of the value falling in the center of the distribution. We also introduce another value, α, which is the probability that the value falls in one of the tails:

For the two-sided range of size p, the z-Values are -z1-α/2 and z1-α/2. In other words, for a random variable Z:

For example, if we want to find the central 95% of the standard normal curve, p=0.95, α=0.05, and z0.975 = 1.96. So, 95% of the values on a standard normal curve lie between -1.96 and 1.96:
Now, we can use our Two-sided z-Values to construct a general expression for the confidence interval:

So, the upper and lower confidence limits for μ are:

To calculate the value of zp in Excel, use the function:
		=NORMSINV(k)
			where k = p;
To find the probability associated with a z-test statistic, use the function:
		=NORMSDIST(k)
			where k is the z-Test Statistic;
To find the y-value for a normal distribution:
		=NORMDIST(k,μ,σ,FALSE)
			where k is the x-value;